
It would be nice if the latest set of quarterly employment tribunal (ET) statistics, published by the Ministry of Injustice today, provided some distraction from the imminence of World War III, the associated bonfire of all our employment rights, and the precisely calculated 18.3142% fall in the value of our houses. Sadly, the statistics provide little more mental stimulation than the latest Stronger IN initiative. Or, indeed, any Stronger IN initiative since the excruciating EU referendum campaign began, some 200 years ago.
Since the last set of these increasingly banal statistics, in March, the Ministry of Injustice has not completed its internal review of the justice-denying fees introduced in July 2013. The chair and members of the Justice committee of MPs appear to have forgotten that they conducted an inquiry into the impact of the fees late last year. And the Corbyn-led Workers’ Party is seemingly no nearer to having a meaningful policy on the matter (prior to last year’s general election, Labour’s policy was to replace the fees with something else, but we still have no idea what that ‘something else’ might be).
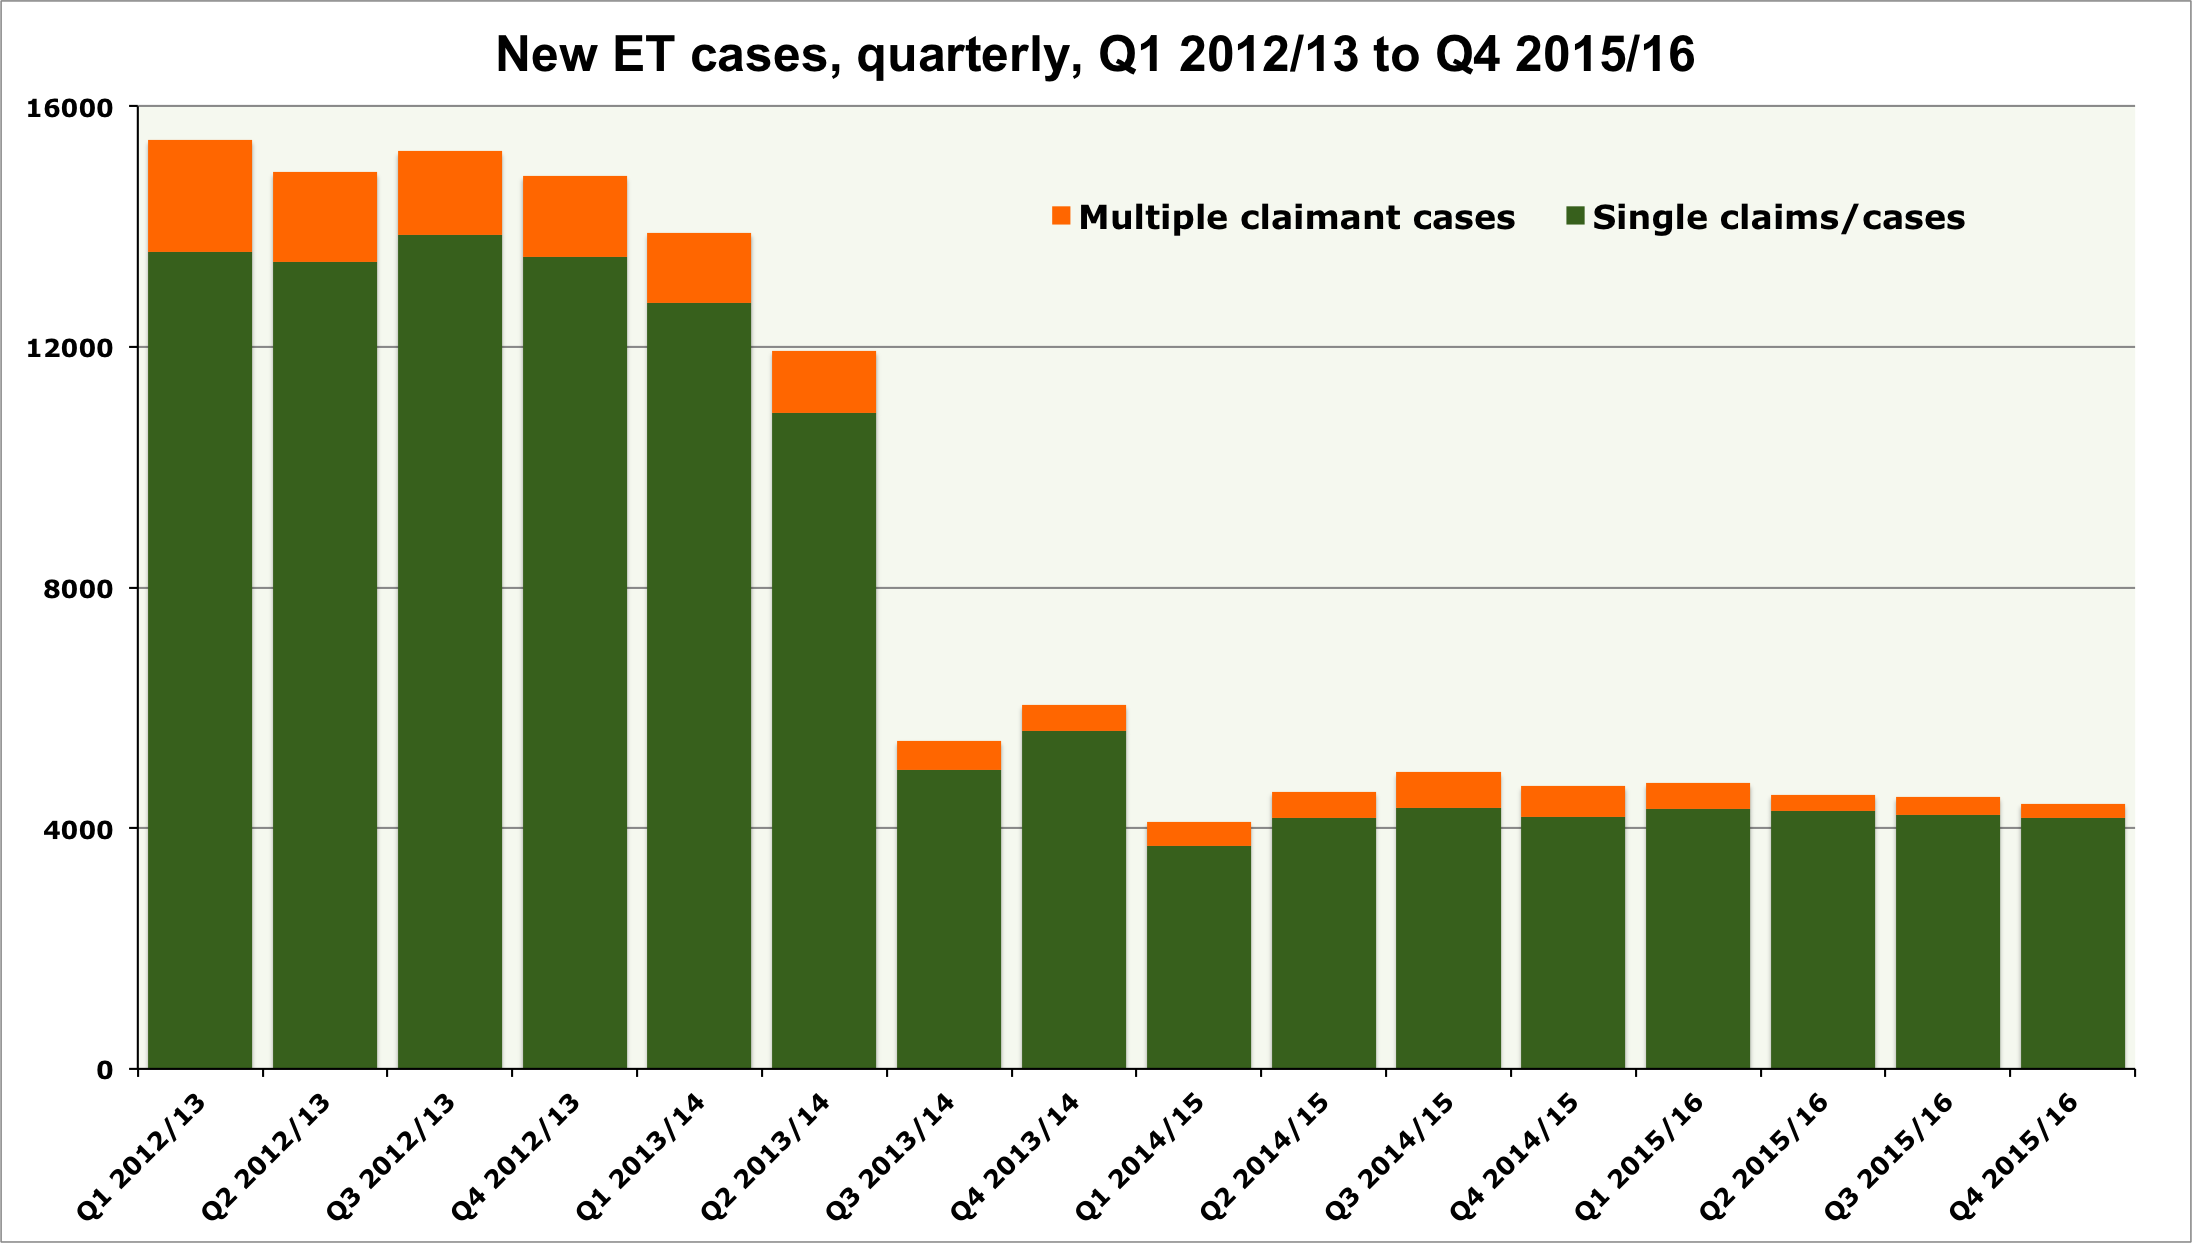
It will soon be three years since those fees of up to £1,200 caused the number of ET cases to fall off a cliff. And it is 12 months almost to the day since Michael Gove – then everyone’s favourite justice secretary, but maybe a little less loved now – agreed to let the Ministry’s internal, so-called post-implementation review go ahead, some 14 months after Liberal Democrat ministers in the Coalition had first tried to hide their blushes by ‘announcing’ it whenever faced with awkward questions about the fees.
However, we know that the Department for Business, Innovation & Skills considers it “too early” to even consider whether reform of the fees regime is needed. And we know that the Ministry of Injustice, having pretty much run out of dosh, is not well placed to bear the increase in operational costs that would inevitably flow from abolition (or a substantial reduction in the level) of the fees. Unless, of course, those extra costs could be covered by, for example, the introduction of fees for respondent employers to defend a claim.
Whatever, I’ve now had as much of this quarterly pointlessness as it is reasonable to expect an unpaid policy wonk to bear. So, for the last time, here are some updated charts showing the impact of ET fees since July 2013. This ain’t rock ‘n’ roll, this is genocide!
Chart 1: New ET cases, Q1 2012/13 to Q4 2015/16
Charts 2 and 3: ET claim outcomes
According to the famed Hancock Theorem of Vexatious ET Claims, the success rate of ET claims should have shot up towards 100 per cent in recent quarters, and the failure rate down towards zero, as all the vexatious and otherwise unfounded claims that were ‘clogging up the system’ prior to July 2013 have been cleverly weeded out by fees.
However, for reasons that I doubt keep Mr Hancock awake at night, that hasn’t happened. The (narrowly defined) success rate has fallen, and the overall failure rate has risen.

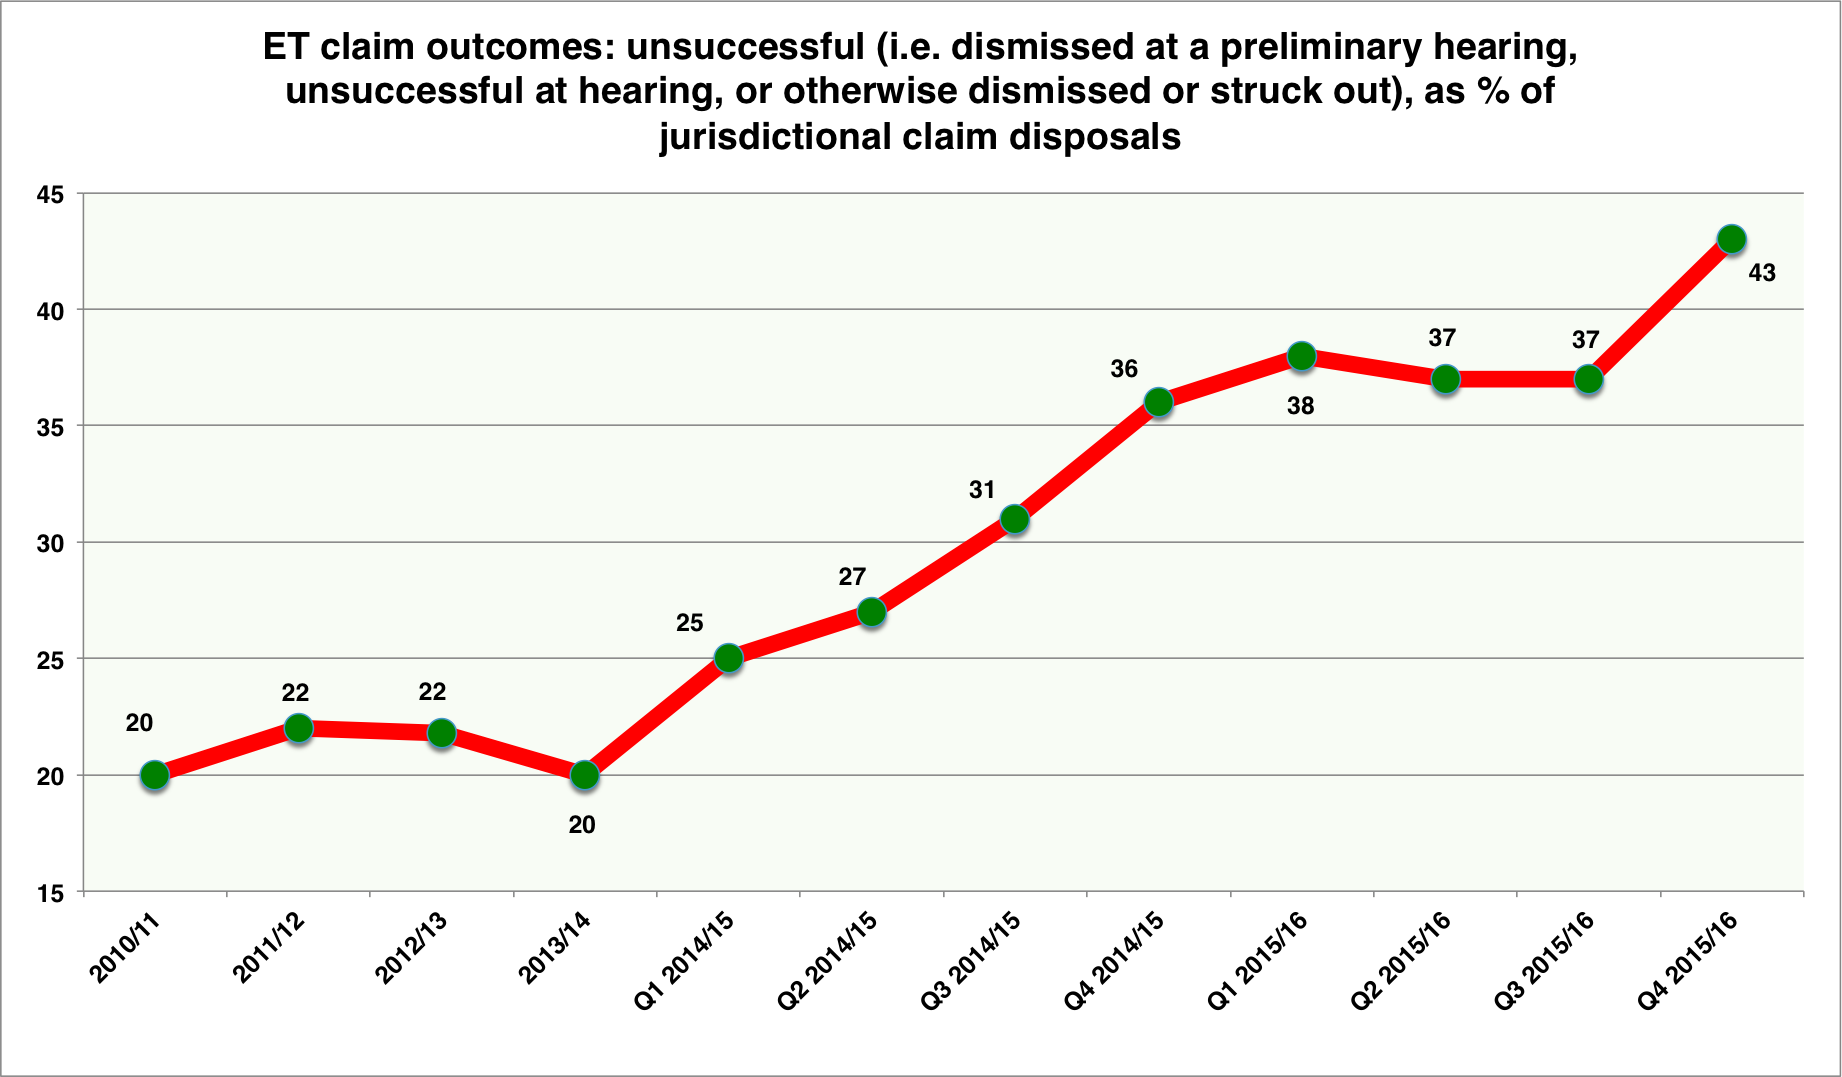
Chart 4: ET fees and Acas early conciliation
As this chart shows, the (very welcome) fact that some 4,000 potential ET single cases are successfully conciliated by Acas each quarter, via the (free) ‘early conciliation’ regime introduced in April 2014, does not balance out the loss of access to justice caused by fees since July 2013. As of the end of March, we were still ‘missing’ some 54,000 ET single claims/cases (i.e. not including multiple claimant cases), and that figure continues to grow by some 4,000 every quarter – so, at the time of writing, is approaching 58,000.
(As previously explained on this blog, the projection on which this chart is based takes into account the mild downward trend in ET case numbers that was evident in mid-2013, as well as the improvement in economic conditions noted by injustice minister Shailesh Vara whenever he comments on the impact of fees).
Of course, the optimistic way of looking at the figures on which this chart is based is that the justice-denying impact of fees could be pretty much eliminated, going forward at least, if Acas could just increase the number of successful conciliations by 100%.
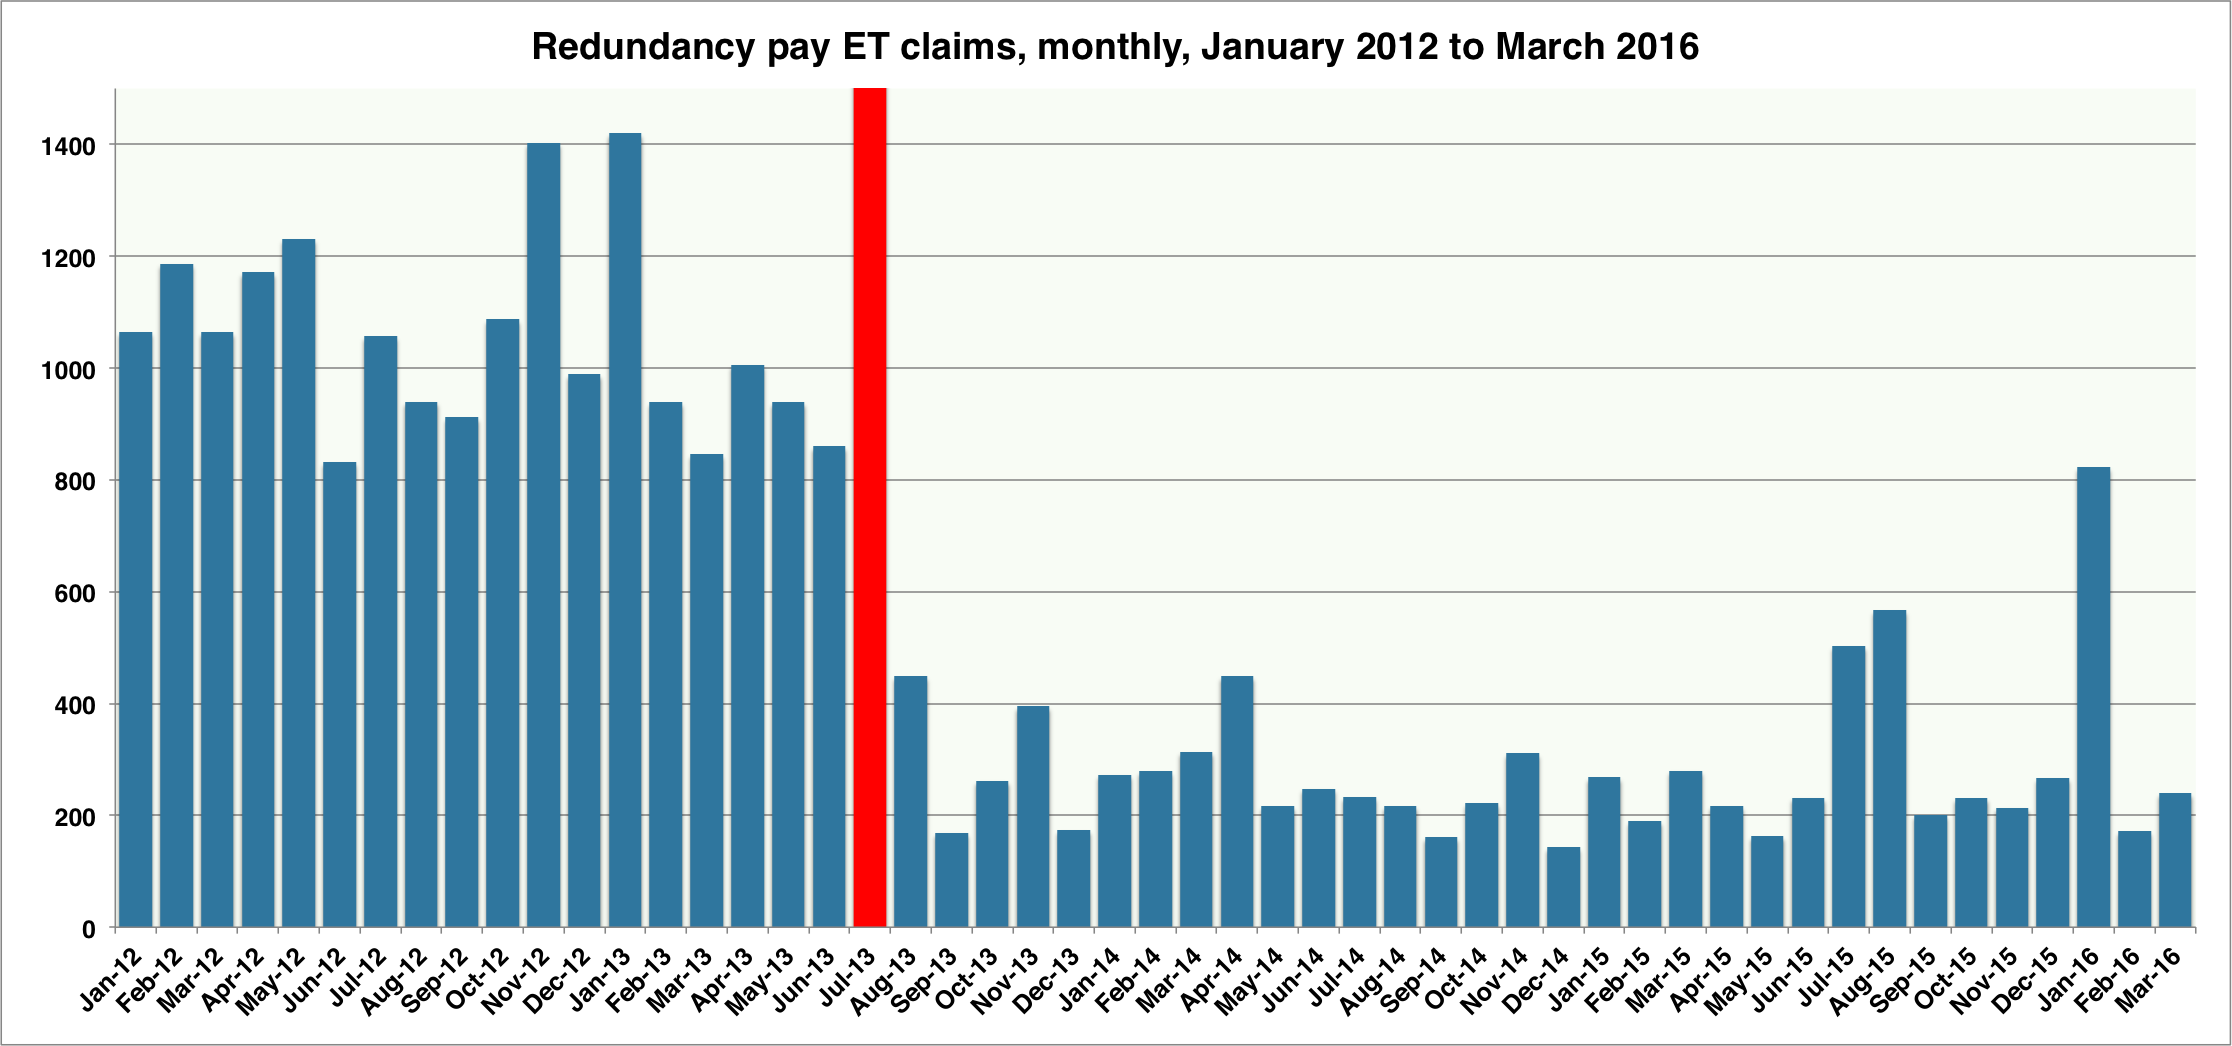
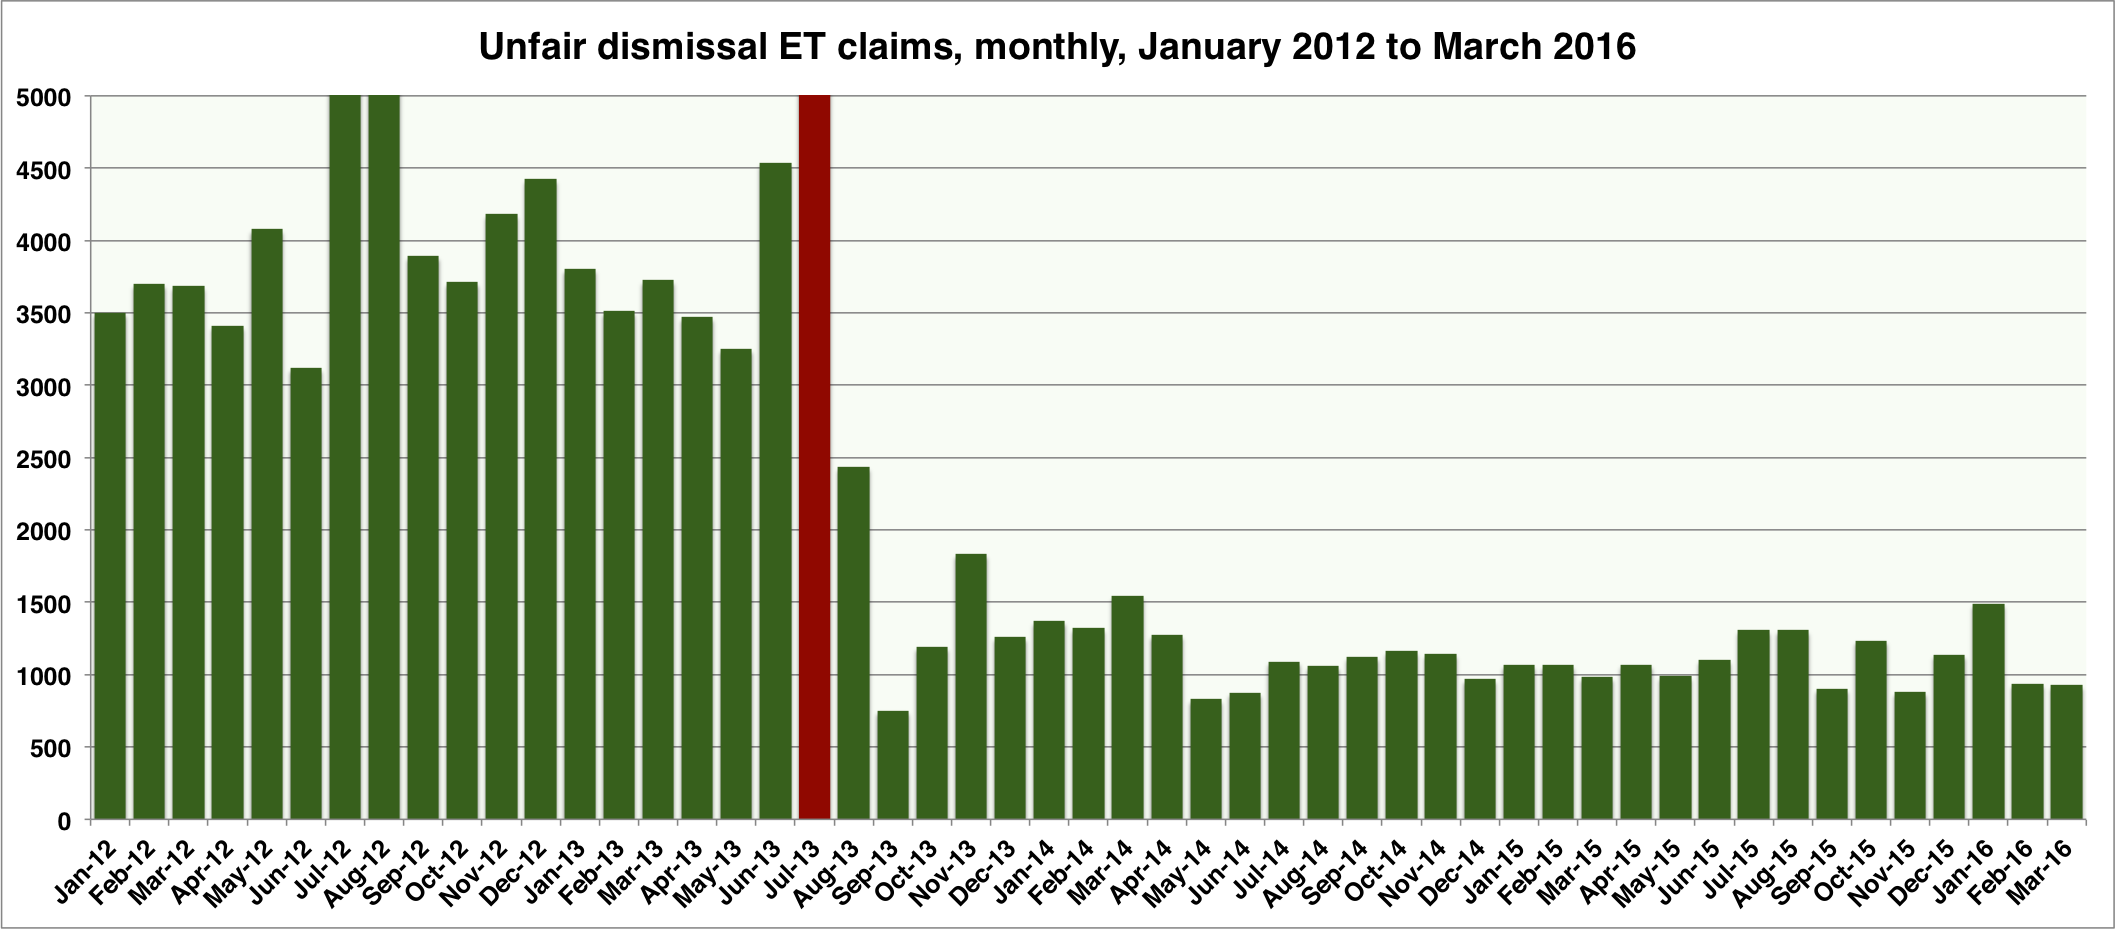
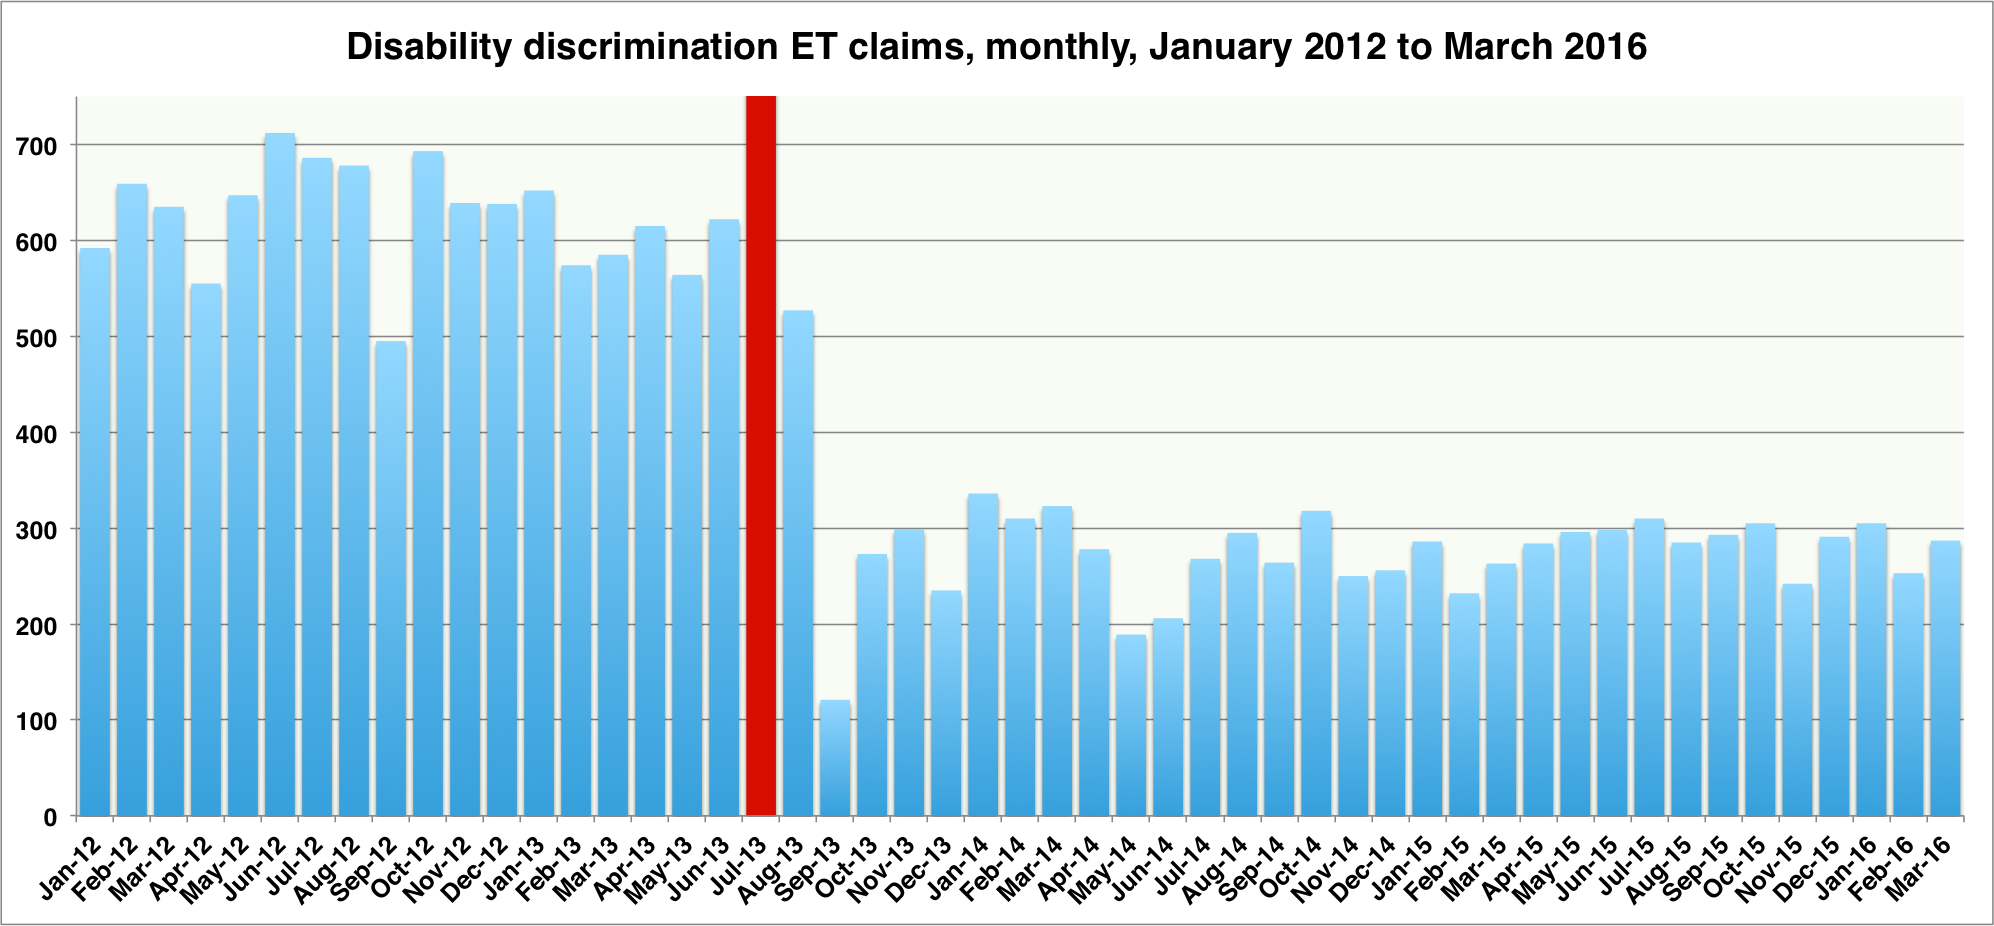
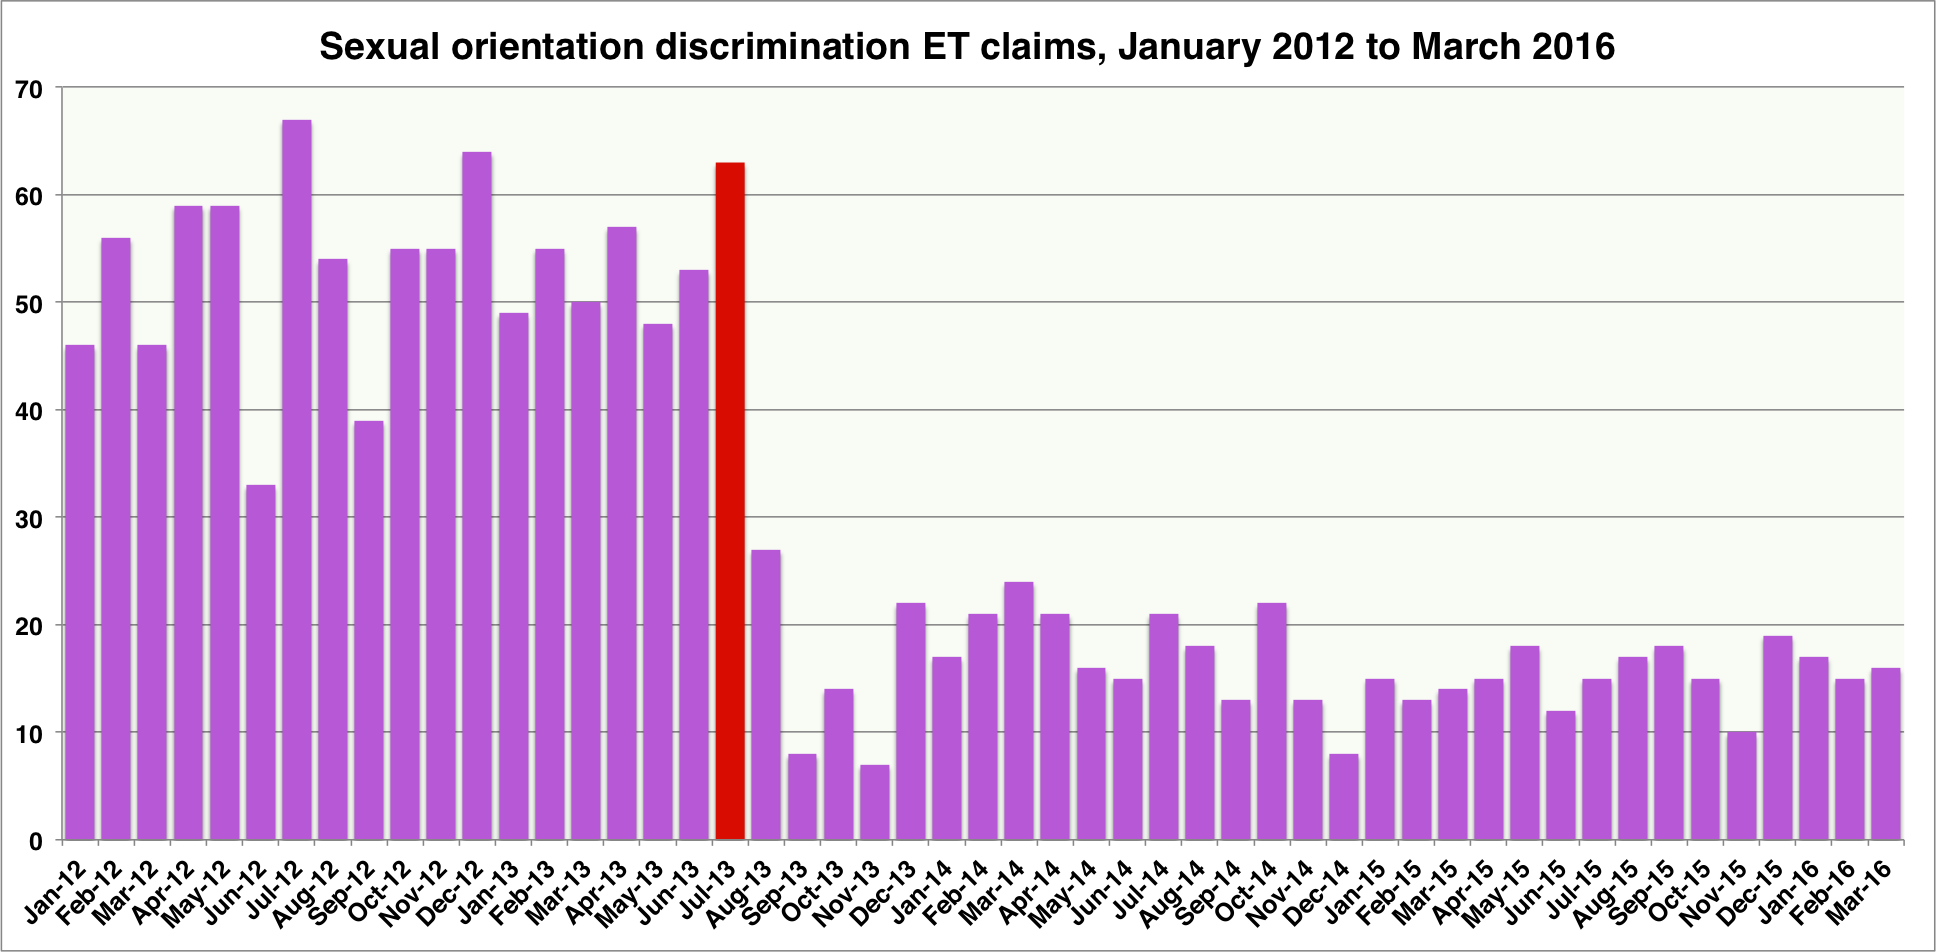
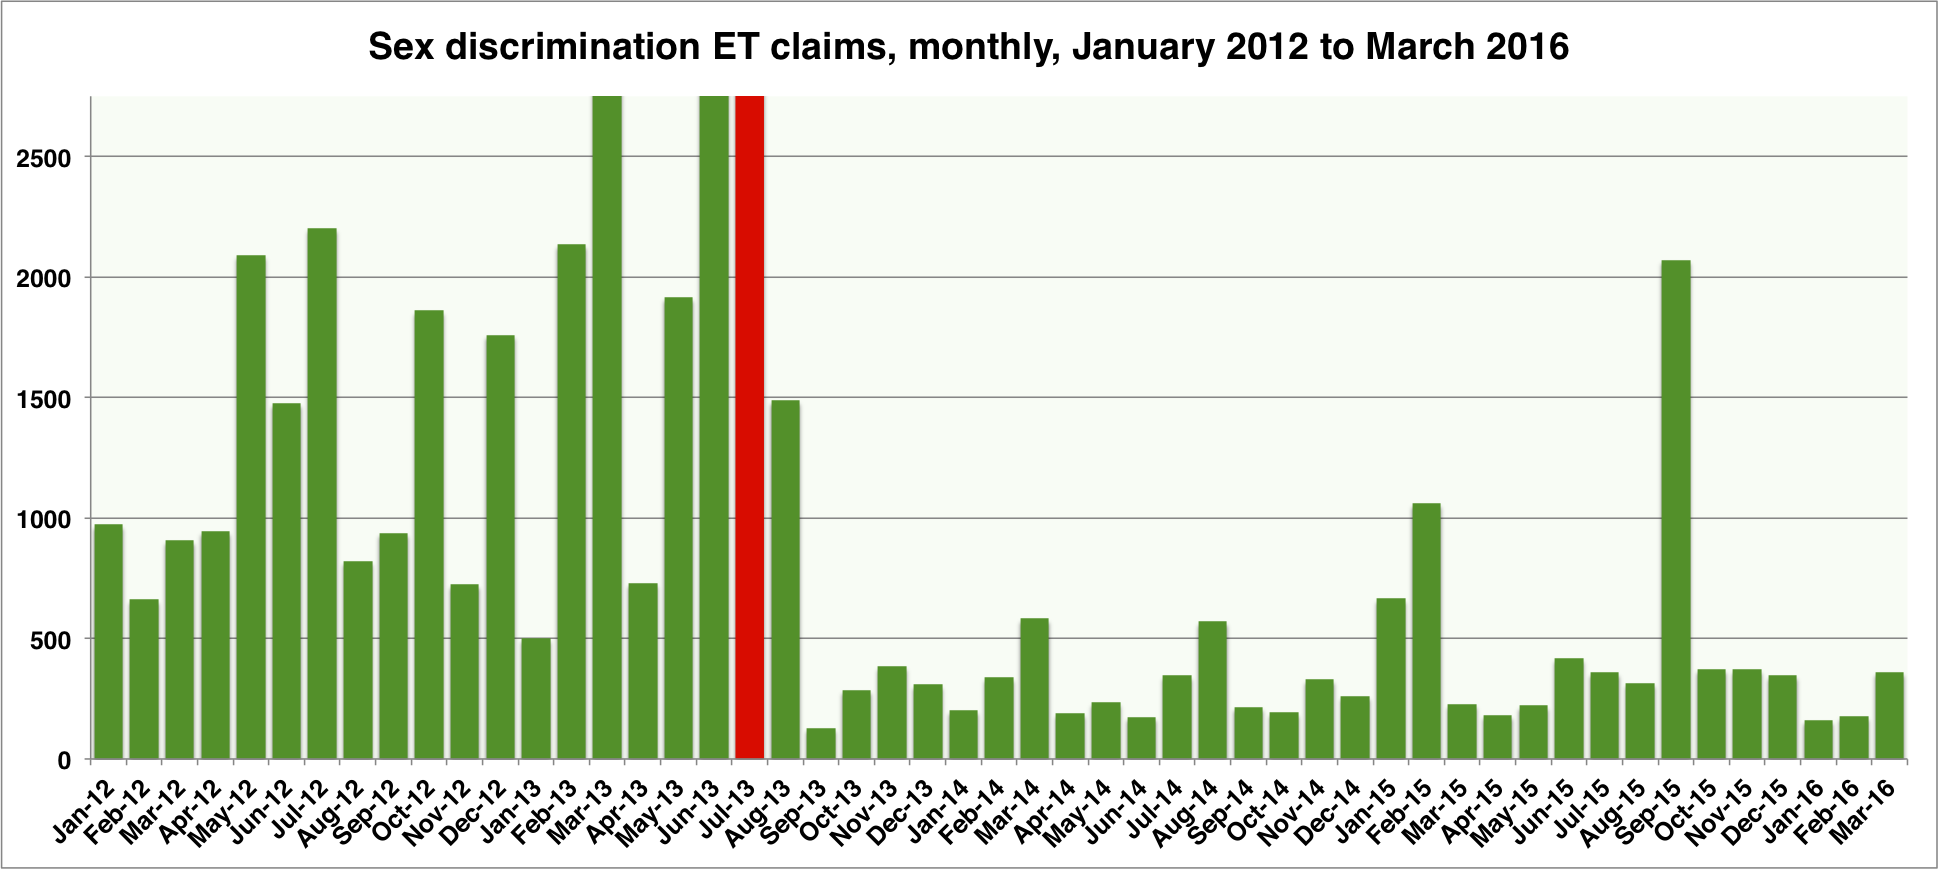
 Charts 5, 6, 7, 8, 9 & 10: selected jurisdictions, monthly


Great reaad thanks