
So, the latest set of quarterly employment tribunal statistics – covering the period April to June 2019 (Q1 of 2019/20) – was published by the Ministry of Injustice yesterday, and it is time to play another round of that thrilling parlour game, Are ET Claim Numbers Continuing To Surge After The Abolition of ET Fees?
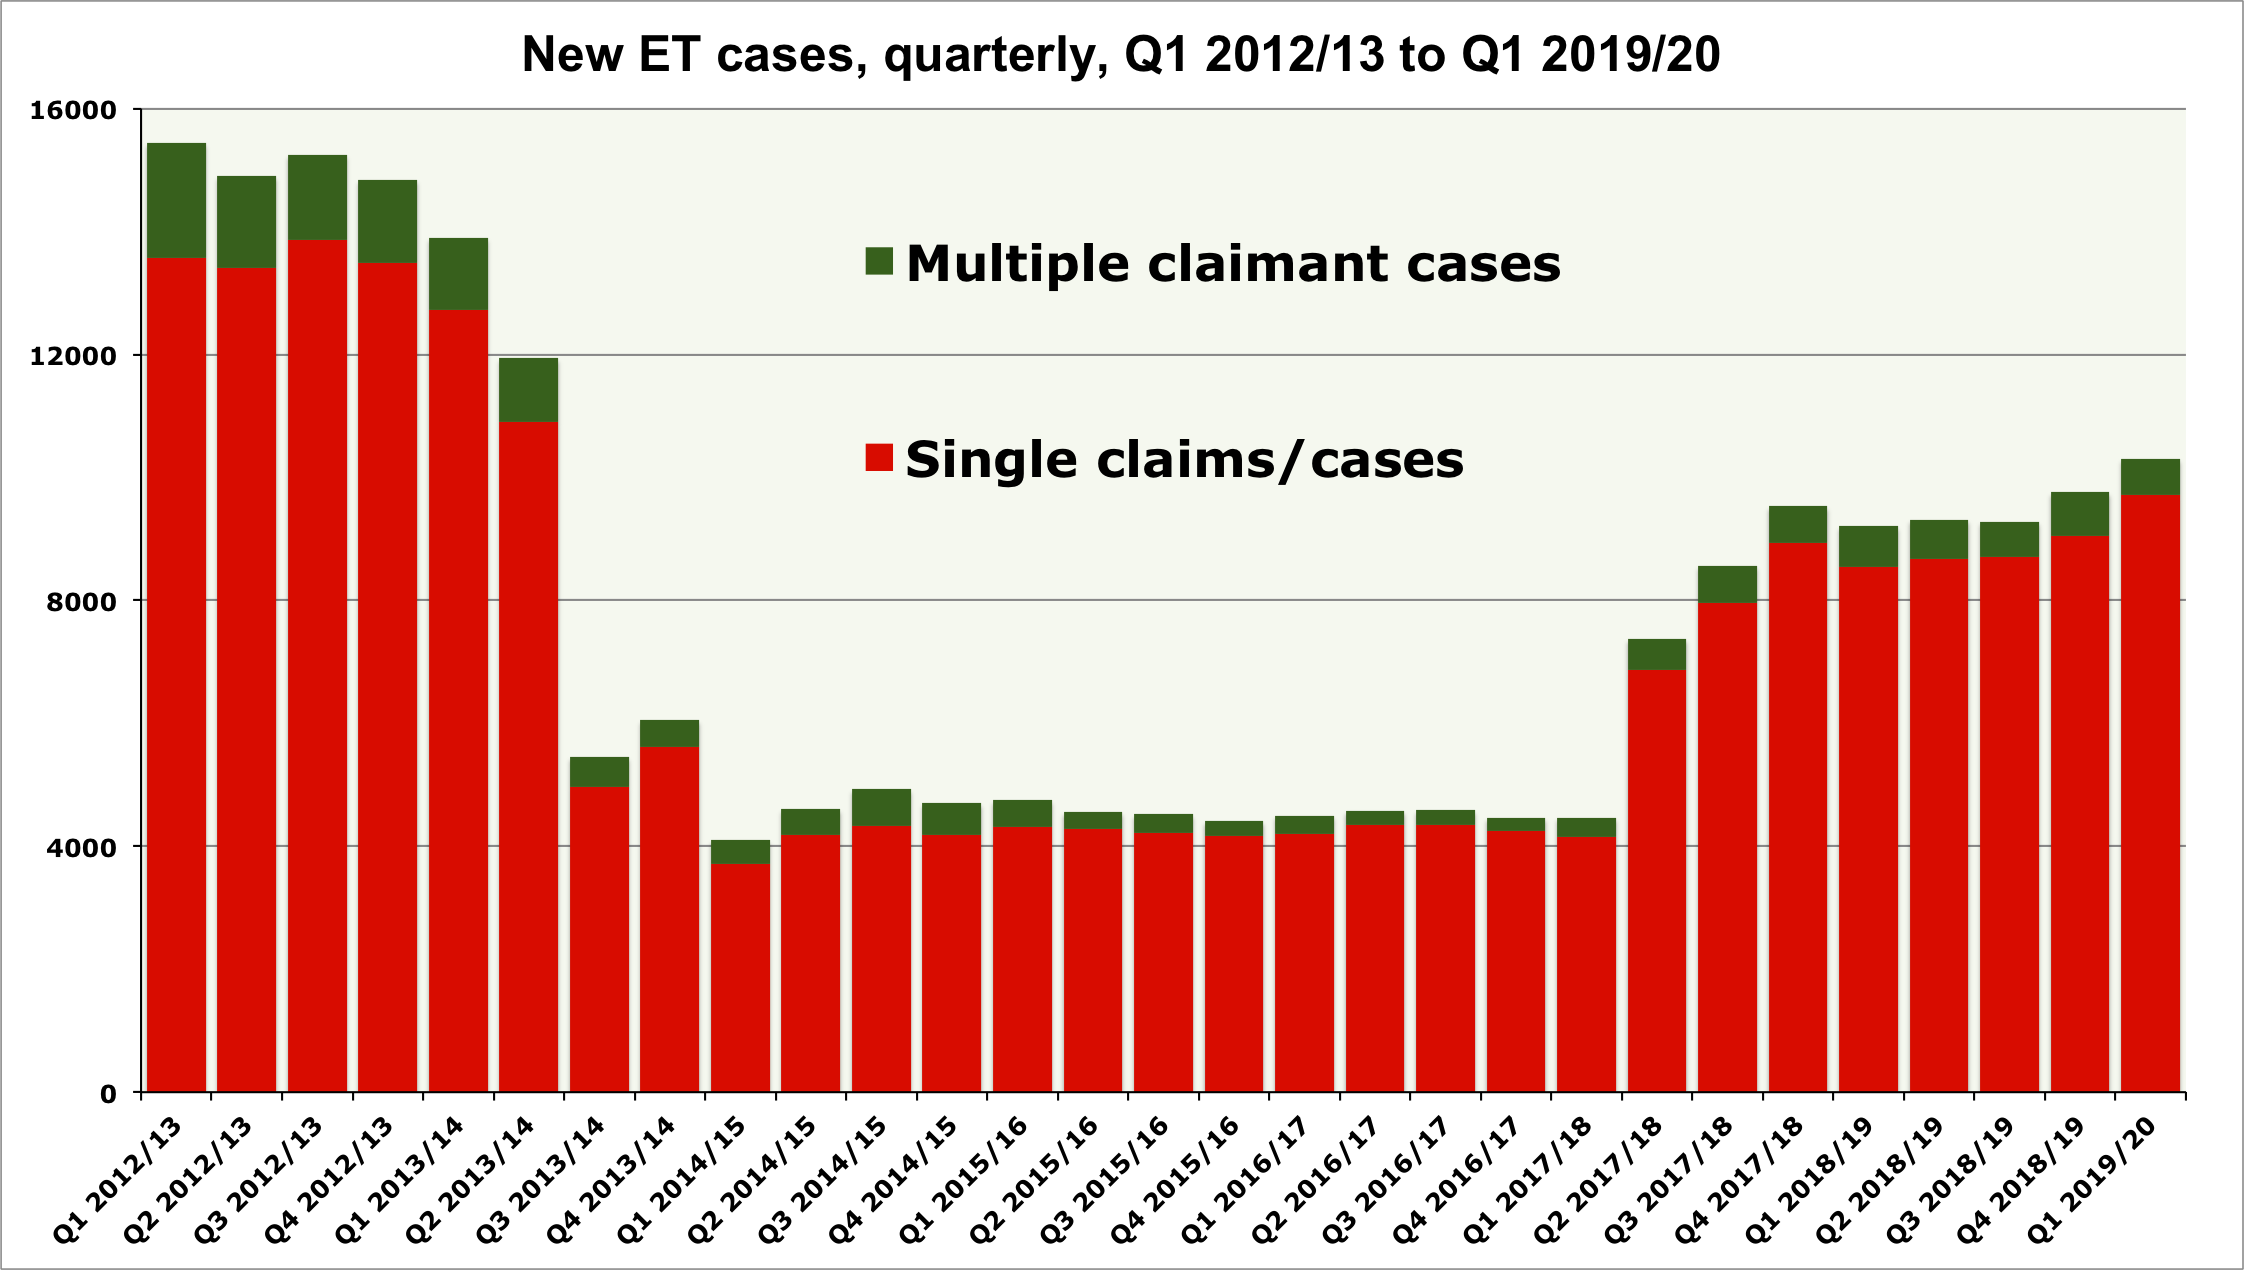
Well, as the Ministry notes in its summary document, the number of single claims/cases increased by 14%, compared to the same quarter in 2018. And the Ministry suggests that this is “most likely due to the continued effect of the abolition of ET fees on 26 July 2017”.
However, the increase was only 7.4% when compared to the previous quarter, so it’s not clear to me whether this counts as a “continued effect”, or just a mild upwards trend that might be due to the abolition of fees two years ago, or might reflect other more current influences (such as the record number of people in employment, or the impact of Brexit). Whatever, here’s a chart, and you can make your own assessment.
Interestingly, the picture is a little different when we look at the number of jurisdictional claims, as I did late last night to see which if any jurisdictions might be driving this mild upwards trend in single claim/case numbers.
For this exercise, I compared the two six-month periods, January to June 2018, and January to June 2019. Both periods post-date the abolition of fees (in July 2017), of course, so the comparison should reveal any ongoing trends. And the results are somewhat surprising, to me at least.
Because, as the following table shows, in 14 of the 22 jurisdictions (including ‘Others’) identified by the Ministry of Injustice in its statistics, the number of claims fell – in many cases quite significantly. And the total number of jurisdictional claims fell by 19.3%.
These 14 jurisdictions include most of the ‘high volume’ jurisdictions, such as Working Time Directive (down 57.2%), Equal Pay (down 18.1%), and Unfair Dismissal (down 4.4%), as well as six of the seven discrimination jurisdictions: the number of Sex Discrimination claims fell by 14.7%, Age Discrimination claims fell by 47.0%, and Pregnancy Discrimination claims fell by 8.3%. In contrast, the number of Breach of Contract claims rose by just 1.6%, and the only jurisdiction in which there was a substantial increase was ‘Others’ (which rose by 49.0%).
Yes, yes, as I have said myself many, many times, care must be taken when analysing the number of jurisdictional claims, as these vary significantly over time (in some jurisdictions at least) due to the influence of large multiple claimant cases. However, in recent months, that hasn’t stopped the planet’s leading employment law firm, GQ Littler, the CIPD and supposedly expert HR publications such as Personnel Today from pushing or running stories about supposedly astonishing spikes in the number of Disability, Pregnancy and Sex Discrimination claims.
| Jurisdiction | Jan – June 2018 | Jan – June 2019 | % change |
| Age discrimination | 1,513 | 802 | -47.0 |
| Breach of contract | 7,118 | 7,230 | 1.6 |
| Disability discrimination | 3,290 | 3,439 | 4.5 |
| Equal pay | 17,197 | 14,084 | -18.1 |
| National Minimum Wage | 233 | 107 | -54.1 |
| Part-time workers Regs | 97 | 116 | 19.6 |
| Public interest disclosure | 1,347 | 1,362 | 1.1 |
| Race discrimination | 1,792 | 1,655 | -7.6 |
| Redundancy (inform & consult) | 3,994 | 2,747 | -31.2 |
| Redundancy pay | 2,441 | 3,118 | 27.7 |
| Religion/belief discrimination | 387 | 321 | -17.1 |
| Sex discrimination | 4,182 | 3,567 | -14.7 |
| Sexual orientation discrimination | 217 | 196 | -9.7 |
| Suffer detriment/unfair dismissal – pregnancy | 833 | 764 | -8.3 |
| TUPE | 373 | 363 | -2.7 |
| Unauthorised deductions | 10,839 | 11,765 | 8.5 |
| Unfair dismissal | 10,217 | 9,763 | -4.4 |
| Working Time Directive | 36,654 | 15,703 | -57.2 |
| Written pay statement | 1,866 | 314 | -83.2 |
| Written statement (dismissal) | 146 | 195 | 33.6 |
| Written statement (T&Cs) | 705 | 634 | -10.1 |
| Others | 9,977 | 14,870 | 49.0 |
| Total | 115,418 | 93,115 | -19.3 |
Yesterday, after I tweeted the chart above, employment lawyer and #ukemplaw tweep Pete Holmes commented that his firm “are down on claims from last year. Unless we have a sudden surge we’ll have dealt with fewer early conciliations and [ET] claims compared to 2018”. The table above suggests Pete’s firm may not be the only one.
However, it is surely only a matter of time before GQ Littler have an article in The Times or Personnel Today about the rocketing 33.6% increase in Written Statement of Reasons for Dismissal claims. All 49 of them.
