
Nine months ago, in June 2018, I noted on this blog that Employment Tribunal (ET) claim/case numbers had still not settled at a new, post-ET fees normal. Having seemingly stabilised in Quarter 3 of 2017/18, the numbers had then increased again in Quarter 4.
However, the latest set of quarterly statistics, published on Thursday, suggest we may now have reached the new normal. Or maybe not quite yet.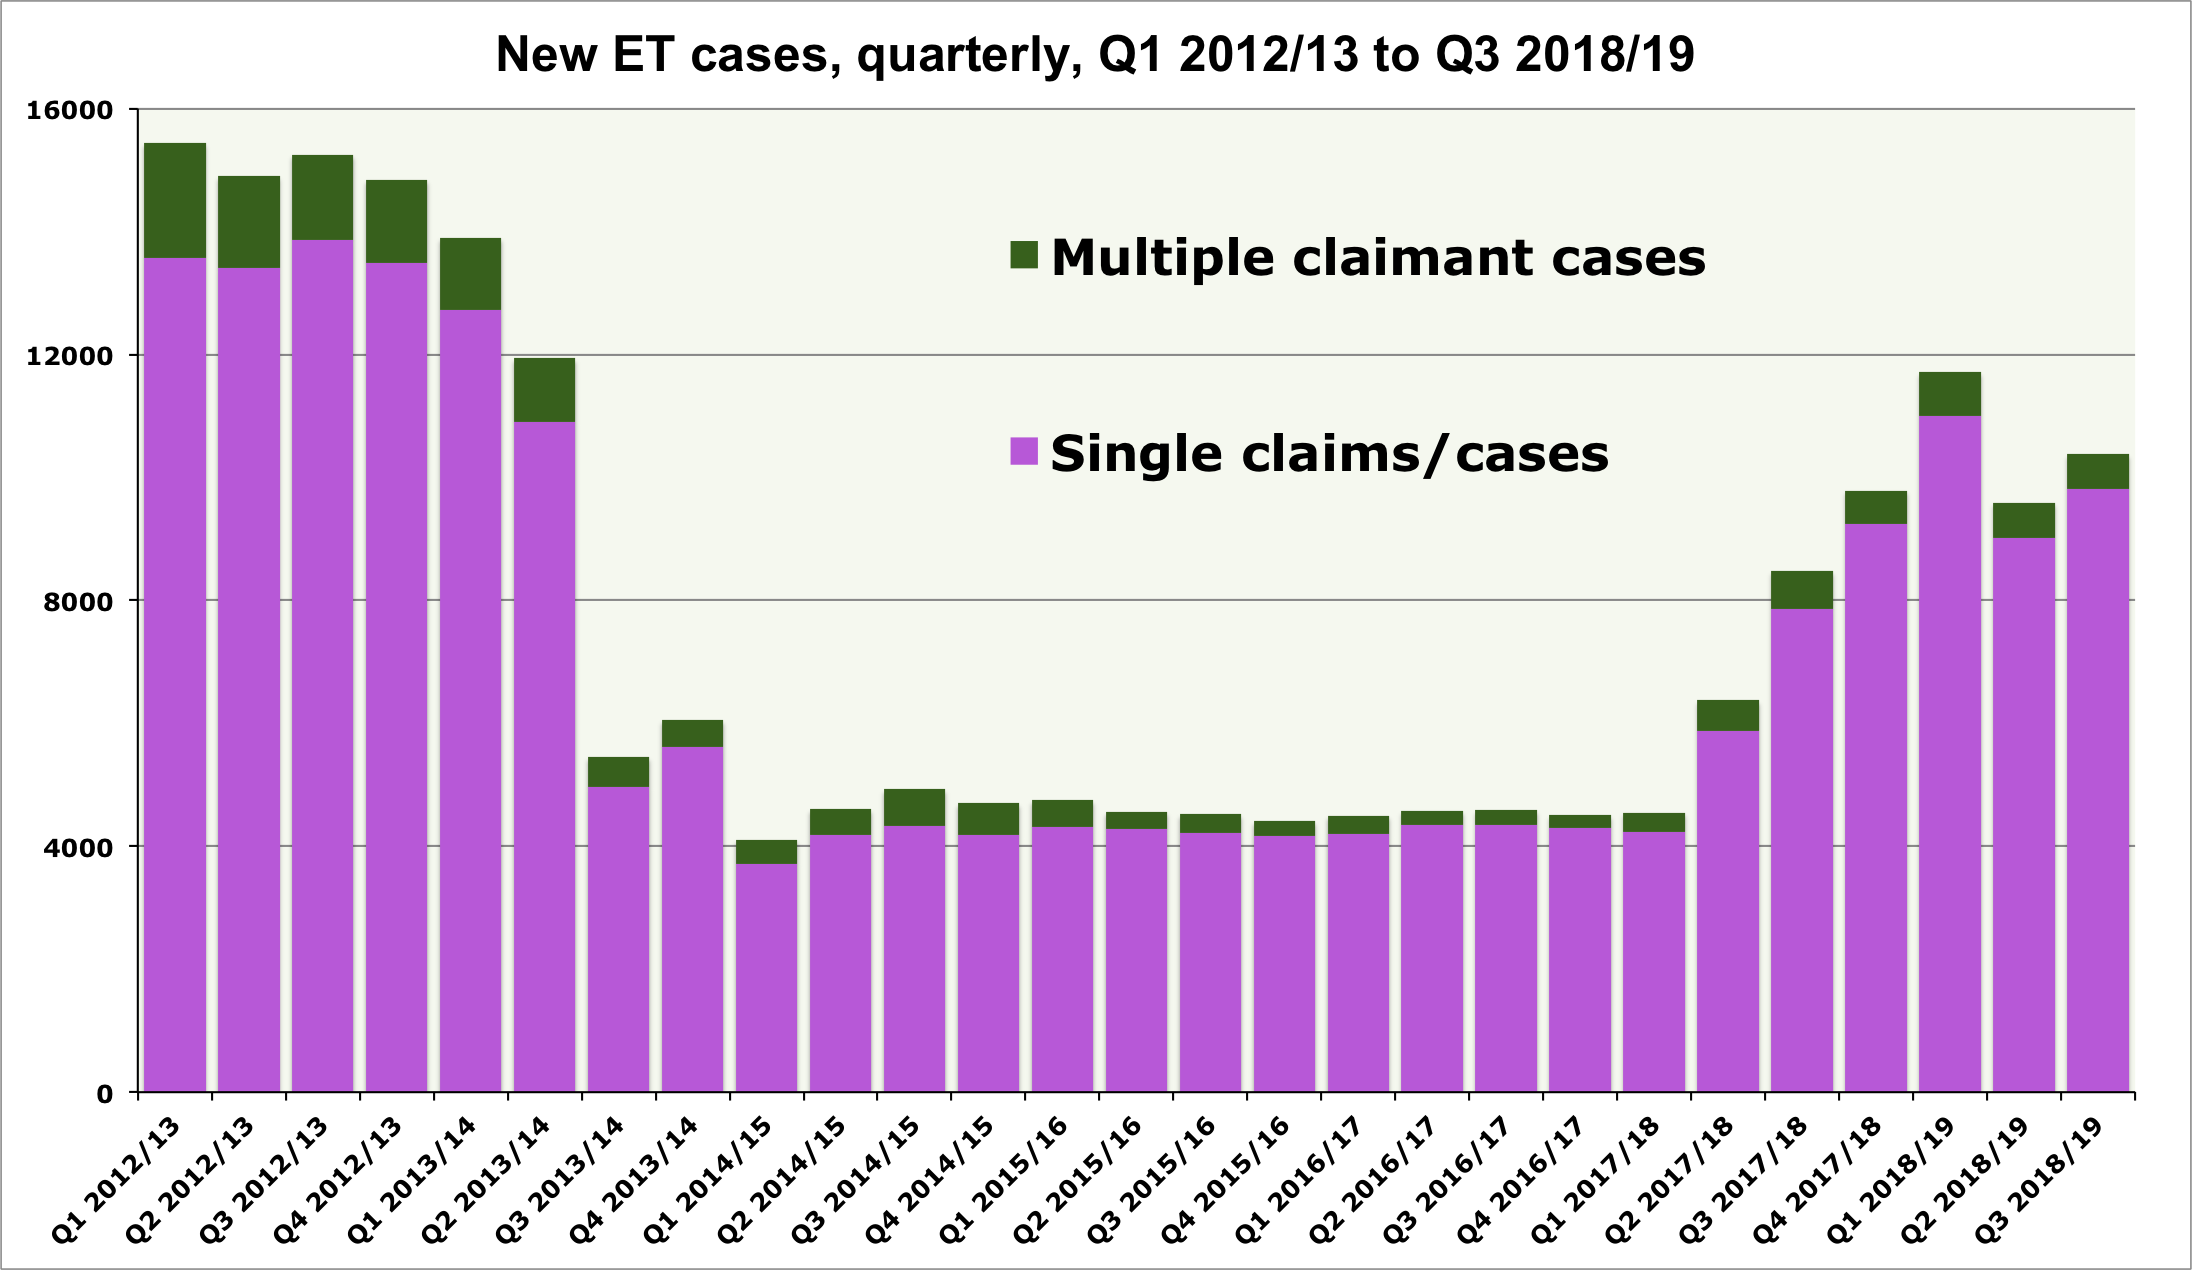
As I tweeted on Thursday, the new normal is perhaps more evident from the monthly figures, given that something unusual happened in June 2018, artificially inflating the figure for Q1 of 2018/19. Then again, there does still seem to be a mild upward trend.
Time – and the next few sets of quarterly statistics – will tell. But my tweeting of the first of the above two charts led one law firm to ask why claim/case numbers have not “reverted to the previous level”. Which is a very good question.
In order to answer it, we first have to define what we mean by ‘the previous level’. Because, following the abolition of fees in July 2017, it was very unlikely that claim/case numbers would return to the level we saw in the years immediately preceding the introduction of the fees in July 2013. For, as the following chart shows, those years were not ‘normal’ – single claim/case numbers were still declining from the peak of 2009/10, caused by the 2008 financial crisis and the resultant economic recession in the UK. Prior to that recession-induced spike, claim/case numbers had plateaued in 2006 and 2007. (Note that the quarterly bars for the first four years at the left of the chart are averages of the annual figure, as the quarterly figures are not readily available).

That pre-existing – but, by mid-2013, relatively mild – downward trend would most likely have continued, at least for a while, had the justice-denying fees regime not been introduced. Some readers will remember that the Ministry of Injustice regularly (and stupidly) cited this pre-existing downward trend as an explanation of the sudden collapse in claim/case numbers after 29 July 2013 – which is why I first calculated the projection shown by the red bars in the chart.
From this chart, we can see that claim/case numbers have in fact reverted to not far short of my projection. Which, of course, is just a projection – it is perfectly possible that claim/case numbers would have continued to decline after Q1 of 2015/16 (from when I have them plateauing), to a level below my projection. And the evident mild upward trend in the actual numbers may yet close the gap further. (Equally, of course, my projection may be too conservative – record levels of employment arguably increase the scope for ET-bound disputes between a worker and their employer.)
Moreover, we could expect claim/case numbers to fall someway short of my projection, in any case, for one very good reason: Acas early conciliation. Since the start of 2016, following the introduction of mandatory early conciliation in May 2014, Acas have successfully settled about 4,000 cases every quarter. And it seems reasonable to assume that, had those worplace disputes not been settled by Acas through the early conciliation process, the great majority would have resulted in an ET claim.
Some of those cases settled by Acas were multiple claimant cases, so for the following adaptation of the chart above, which shows single claims/cases, I have reduced the number of EC settled cases by 10%, before adding them to the number of ET claims/cases.
This is all a bit crude (and I’d welcome the thoughts of Acas peeps), but what we can say is that, broadly speaking, the number of ET single claims/cases has now reverted to the level we might have expected it to be at, had fees and Acas early conciliation not been introduced in 2013 and 2014 respectively.
 (Note: For this chart, I have taken the liberty of averaging out the unusual spike in June 2018).

Pingback: ET claim statistics: No alarms, no surprises | Labour Pains