
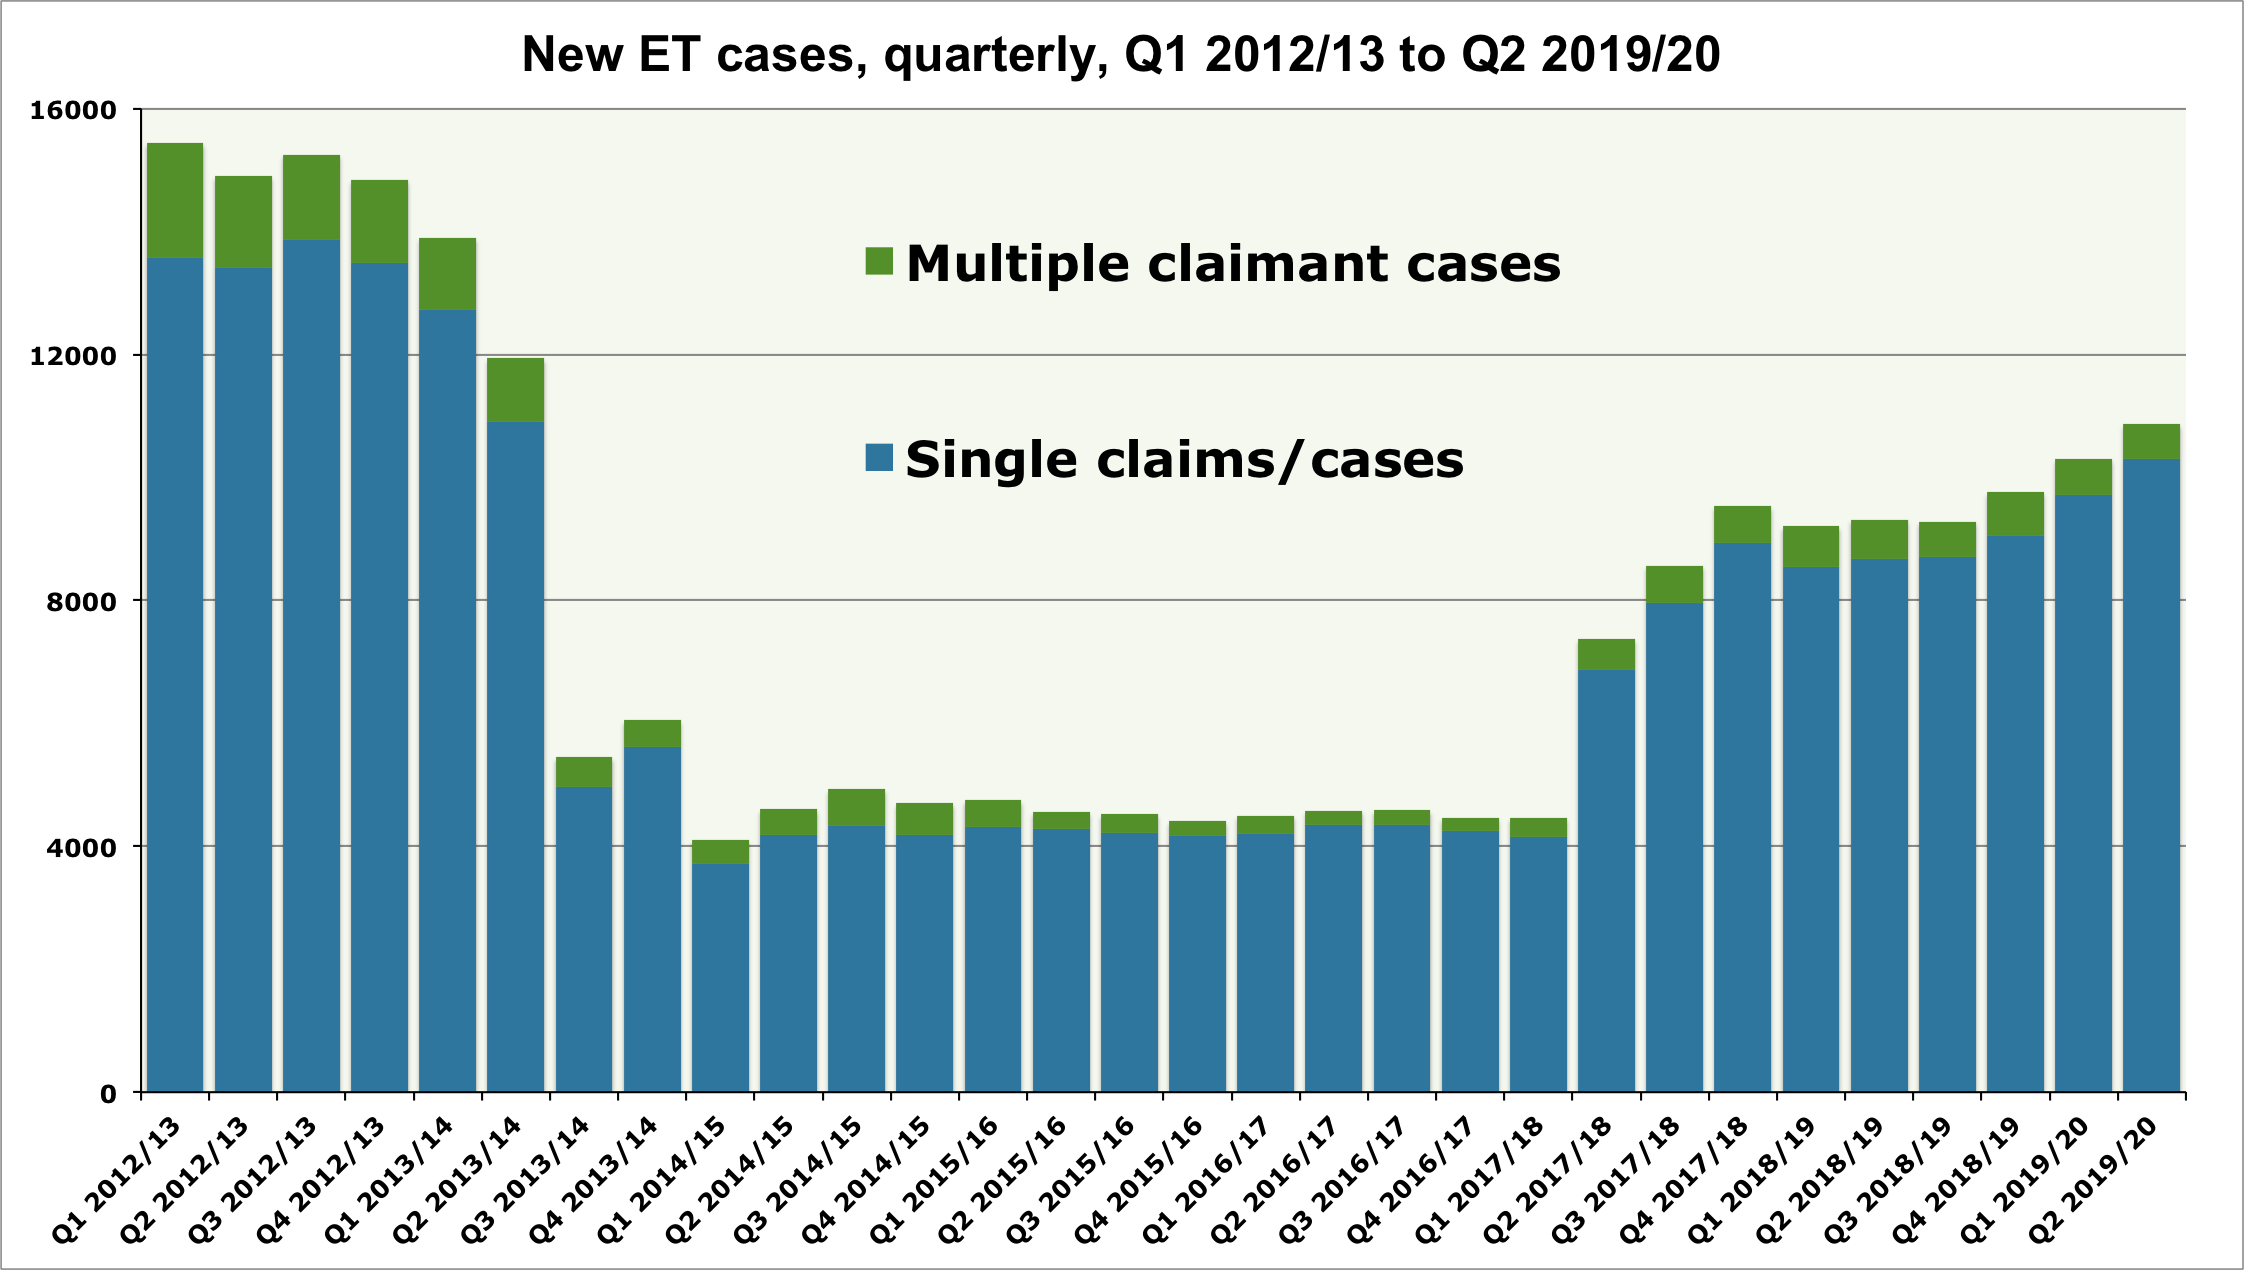
On Friday, when you were possibly too busy drowning your sorrows to notice, the Ministry of Injustice published the latest set of quarterly employment tribunal (ET) statistics, covering the period July to September 2019 (Q2 of 2019/20). And, at first glance, there seemed to be good news for underemployed employment lawyers: a stonking 23% rise in the number of single claims/cases, from 9,722 in Q1, to 12,007.
However, in its commentary on the data, the Ministry notes that this increase is largely due to “the inclusion of 1,700 [single] cases that will be reclassified as multiple claims once fully vetted”. And a quick scan of Table C3 of Annex C (ET receipts) suggests that most of these 1,700 single cases awaiting reclassification as multiple claims were lodged in Scotland in August. Removing these 1,700 cases from the data leaves the increase in single claims/cases looking somewhat less dramatic, but it is worth noting that the number of such claims/cases was nevertheless above 10,000 for the first time since Q2 of 2013/14.
Then again, it is not at all clear from the data on jurisdictional claims what is driving the relatively mild but steady upwards trend in the number of single claims/cases since Q3 of 2018/19. For, as the following table shows, in all but three of the 22 jurisdictions (including ‘Others’) identified by the Ministry of Injustice in its statistics, the year-on-year trend is either downwards (15 jurisdictions) or only marginally upwards (four jurisdictions). So, this quarter, we should at least be spared from garbage press reports about the impact of #MeToo on ET claim numbers.
| Jurisdiction | Jan – Sept 2018 | Jan – Sept 2019 | % change |
| Age discrimination | 1979 | 1365 | -31.0 |
| Breach of contract | 10382 | 10540 | 1.5 |
| Disability discrimination | 5025 | 5443 | 8.3 |
| Equal Pay | 24804 | 20268 | -18.3 |
| National Minimum Wage | 311 | 231 | -25.7 |
| Part-time workers Regs | 204 | 213 | 4.4 |
| Public Interest Disclosure | 1990 | 2007 | 0.9 |
| Race discrimination | 2617 | 2561 | -2.1 |
| Redundancy (inform & consult) | 4817 | 3628 | -24.7 |
| Redundancy pay | 3687 | 4321 | 17.2 |
| Religion/belief discrimination | 549 | 511 | -6.9 |
| Sex discrimination | 7954 | 4670 | -41.3 |
| Sexual orientation discrimination | 338 | 327 | -3.3 |
| Suffer detriment/UD – pregnancy | 1222 | 1181 | -3.4 |
| TUPE | 585 | 468 | -20.0 |
| Unauthorised deductions | 17808 | 16306 | -8.4 |
| Unfair dismissal | 16455 | 15024 | -8.7 |
| Working Time Directive | 42680 | 19876 | -53.4 |
| Written pay statement | 2065 | 490 | -76.3 |
| Written statement (dismissal) | 222 | 224 | 0.9 |
| Written statement (T&Cs) | 1053 | 932 | -11.5 |
| Others | 14455 | 21544 | 49.0 |
| Total | 161202 | 132130 | -18.0 |
Finally, the Ministry’s commentary on the latest set of data confirms that the mean age at disposal of single ET claims/cases continues to creep upwards, and in Q2 was greater than in any quarter since 2014.

However, talk to almost any employment lawyer, and they will tell you that even this figure fails to reflect the long delays that they are currently experiencing in the processing of their ET cases. Which is setting off an alarm deep inside this wonk’s sleepy brain: We currently have a situation – a steadily rising number of claims (singles, at least), and a chorus of complaint (from employment lawyers) about the ET system being clogged up – that is not unlike the situation in 2011 – a steadily rising number of claims (all claims, at least – single claims/cases were actually falling, but no one yet knew), and a chorus of complaint (from employer bodies such as the CBI) about the system being clogged up – that was used by ministers to justify the proposed introduction of ET fees.
